 HOME
HOME 書き込む
書き込む
|
HOME |
書き込む |
LISP は AI 向けの言語と言われていますが、数値計算も得意分野の一つです。 実際、数値を扱うプログラムを書くことは非常に容易です。
計算結果を gnuplot を使って表示する方法が皆様の参考になれば幸いです。
wgnuplot.exe と同じディレクトリに入っている pgnuplot.exe は、他のプログラムから gnuplot にコマンドを渡すのに使います。
環境変数 GDFONTPATH をフォントのあるディレクトリ(例えば、"C:\WINDOWS\FONTS\")に設定しておくと png ファイル (portable network graphics) にイメージを書き出すときにそのディレクトリにある TrueType (*.ttf) フォントと Adobe Type 1 (*.pfa) フォントが使用できます。
> (compile-file "fractal.lisp")
> (load "fractal")
> (gplot "plot sin (x)")と入力してみてください。サインカーブが描かれればインストールは成功です。
以下に gnuplot を操作する関数を挙げます。
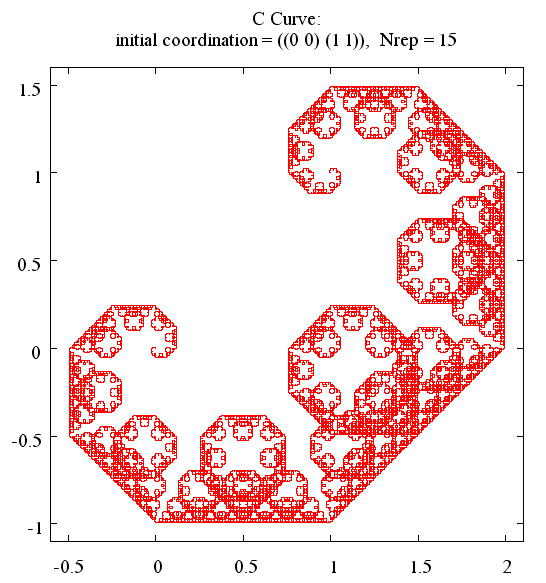
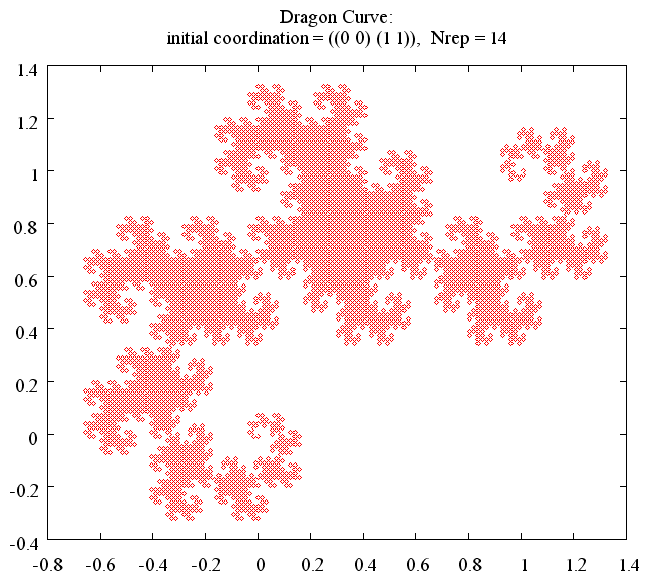
> (c-curve '((x1 y1)(x2 y2)) n) > (dragon '((x1 y1)(x2 y2)) n)と入力してください。ここで、(x1 y1) (x2 y2) は初期座標、n は繰り返しの回数です。 図1、2に示すような図がえられます。
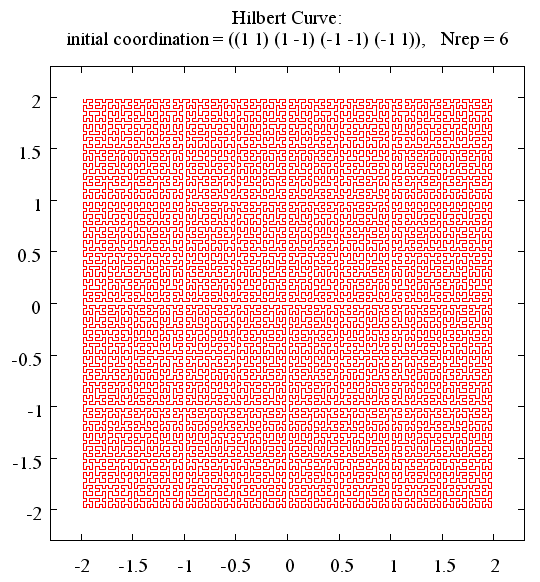
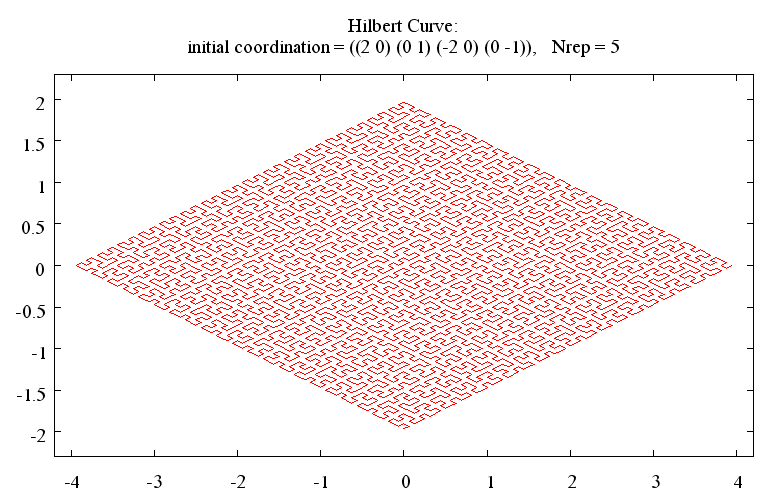
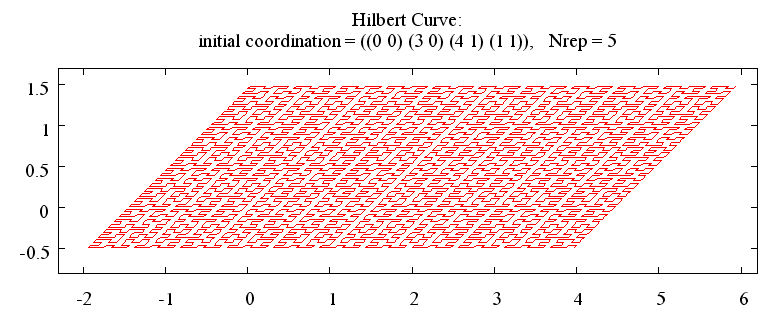
> (hilbert '((x1 y1) (x2 y2) (x3 y3) (x4 y4)) n)と入力してください。ここで、(xi yi) (i = 1 ∼ 4) は初期座標、n は繰り返しの回数です。 初期座標には平行四辺形を与えてください。 もちろん、正方形、長方形、ひし形を含みます。位置や方向は問いません。 図3〜5に示すような図がえられます。
;;; send command to gnuplot                ; (mark 3)
(let (gp dir)
  (defun gplot (s)
    (or gp
	(setq gp (make-pipe-output-stream *gnuplot* :buffered t)))  ;(mark 3a)
    (or dir                                                          ;(mark 3b)
	(setq dir (ext:cd)))
    (let ((dir1 (ext:cd)))
      (unless (equal dir dir1)
	(setq dir dir1)
	(format gp "cd \'~A\'~%" (string-right-trim "\\" (format nil "~A" dir)))
	(force-output gp)))
    (when (stringp s)
      (format gp "~A~%" s)                                           ;(mark 3c)
      (force-output gp)
      (when (string-equal s "exit")                                  ;(mark 3d)
	(close gp)
	(setq gp nil)))))
(defstruct v (x 0.0 :type single-float) (y 0.0 :type single-float)) ; (mark 2)
構造体 "v" のスロットはそれぞれ x 座標 y 座標を表す x, y の2つです。スロットのタイプを
指定しておくと計算が速くなります。構造体を定義すると、
それに付随する関数も自動的に定義されます(注2)。この例では以下の4つの関数が定義されます。
;;;;;;;;;;;;;;; functions for 2D vectors  ;;;;;;;;;;;;;;;;;;;;;;; (mark 4)
;;; add vectors
(defun v+ (&rest argvs)
  (make-v :x (apply '+ (mapcar #'v-x  argvs))
          :y (apply '+ (mapcar #'v-y  argvs))))

;;; subtract vectors
(defun v- (&rest argvs)
  (make-v :x (apply '- (mapcar #'v-x  argvs))
          :y (apply '- (mapcar #'v-y  argvs))))

;;;multiplication or inner product
(defun v* (v0 n)
    (make-v :x (* (v-x v0) n)
            :y (* (v-y v0) n)))

;;; convert initial input to  structure v
(defun l2v (ls0)
  (make-v :x (coerce (first ls0) 'single-float) :y (coerce (second ls0) 'single-float)))

;;; calculating center
(defun vcl (ls0)
  (let ((n (length ls0)))
    (make-v :x (/ (apply '+ (mapcar #'v-x ls0)) n)
            :y (/ (apply '+ (mapcar #'v-y ls0)) n))))
マクロ c-gen は v1, v2 を底辺とする 直角二等辺三角形の頂点の位置ベクトルを求めます (a)。必ずインライン展開されるように マクロで定義しました。
c-curve が本体の関数です。 実行速度を上げるために (optimize (speed 3) (safety 0)) の宣言をします (b0)。 C-curve の点の総数は、繰り返し回数 n から、 2n + 1 で求まります。そこで、全ての点を格納できる配列 *fractal-array* を作り (b1)、 初期座標を配列の両端にセットします (b2, b3)。 次に、間の点を i を 0 から (n - 1) まで増やして 順番に埋めていきます(c1)。 i 番目のときの配列のインデックスの間隔 d は (c2) で求まります。新しく追加する点のインデックス idx は配列の最後のインデックス asize0 より小さい間 d から 2d ずつ 増加していきます(c3)。 新しく求める点の座標はインデックス (idx - d), (idx + d) の座標から c-gen を用いて求めます(c4)。 これを i = (n - 1) まで繰り返すと、配列はだんだんつまっていき、 最後に全部埋まります。
そうなったら、 plot-c/dragon を使ってプロットします (d1)。 plot-c/dragon は、まず、 配列 *fractal-array* の要素を *fractal-data-file* に書き出し (e1)、さらにプロット用 コマンドファイル *fractal-plot-file* をつくり (e2)、それを gnuplot にロードさせます (e3)。gnuplot がプロットしている間に、 *fractal-array* に nil をセットし (e4)、不要になったメモリー を開放します (e5)。配列を使うと、リストを使って繰り返し計算するよりゴミが少ないという利点が あります。また、計算速度も速くなります。
;;; generate points for c curve              ; a
(defmacro c-gen (v1 v2)
  (let ((gv1 (gensym)) (gv2 (gensym)))
    `(let ((,gv1 ,v1) (,gv2 ,v2))
       (make-v :x (* 0.5e0 (+ (v-x ,gv1) (v-x ,gv2) (- (v-y ,gv2) (v-y ,gv1))))
               :y (* 0.5e0 (+ (v-y ,gv1) (v-y ,gv2) (- (v-x ,gv1) (v-x ,gv2))))))))

;;; making a C curve, (c-curve '((x1 y1) (x2 y2)) n)  ; b
(defun c-curve (ini n)
  (let* ((asize0 (expt 2 n))
         (asize (1+ asize0)))
    (declare (optimize (speed 3) (safety 0)))                                    ; b0
    (setf *fractal-array*                    (make-array asize :element-type 'v) ; b1
          (svref *fractal-array* 0)          (l2v (first ini))                   ; b2
          (svref *fractal-array* asize0)     (l2v (second ini)))                 ; b3
    (dotimes (i n)                                                               ; c1
      (let* ((d (expt 2 (- n i 1)))                                              ; c2
             (d2 (* 2 d))
             (idx (* -1 d)))
        (while (< (incf idx d2) asize0)                                          ; c3
          (setf (svref *fractal-array* idx)                                      ; c4
		(c-gen (svref *fractal-array* (- idx d))
		       (svref *fractal-array* (+ idx d)))))))
  (plot-c/dragon "C" asize ini n)))                                              ; d1

;;; plotting the result of calculation of C/dragon
(defun plot-c/dragon (type asize ini n)
  (with-open-file (out *fractal-data-file* :direction :output)                   ; e1
    (dotimes (i asize)
      (format out "~A ~A~%" (v-x (svref *fractal-array* i)) (v-y (svref *fractal-array* i)))))
  (with-open-file (out *fractal-plot-file* :direction :output)                   ; e2
    (format out "set title \"~A Curve:\\ninitial coordination = ~S,  Nrep = ~D\"~%" type ini n)
    (format out "set key off~%")
    (format out "set size square~%")
    (format out "set size ratio -1~%")
    (format out "set autoscale~%")
    (format out "plot \"~A\" w l 1~%" *fractal-data-file*))
  (gplot (format nil "load \"~A\"" *fractal-plot-file*))                          ; e3
  (nilf *fractal-array*)                                                          ; e4
  (sleep (* asize 0.0001))
  (gc)                                                                            ; e5
  t)
|
HOME |
書き込む |